Considering multiple factors when conducting climate change scenario analysis
The map below shows a flood risk assessment of all electrical transmission substations in Australia. Substations not exposed to flooding are shown in purple, while those subject to flood risk are highlighted in yellow. A notable number of substations are located in flood-prone areas, which is unsurprising given their frequent placement in low-lying regions near demand centres, rivers, and industrial zones.
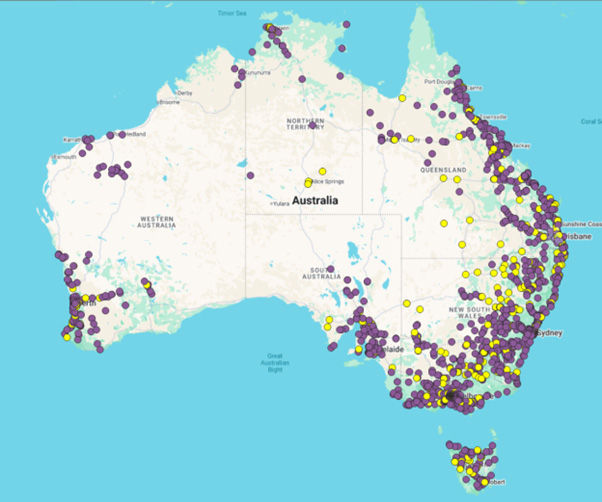
So why does this matter? Electrical infrastructure is highly sensitive to inundation. Transformers, switchgear, relays, and control systems are not designed to withstand water exposure even 20–30 cm of flooding can cause failure. In addition to the risk of equipment damage, the combination of electricity and floodwater presents a severe electrocution hazard. For this reason, substations may be pre-emptively shut down during flood events, leading to widespread disruption for households, businesses, and critical services.
How is this a useful factor in climate change scenario analysis?
This risk is illustrated in the example below, where a manufacturing facility (outlined in blue) is directly exposed to flooding. A nearby transmission substation (yellow dot) is also at risk, and all access routes to the site are impacted. In such a scenario, the business could potentially face direct flood damage, loss of power supply, and restricted access, compounding both operational and financial disruption until recovery is possible.

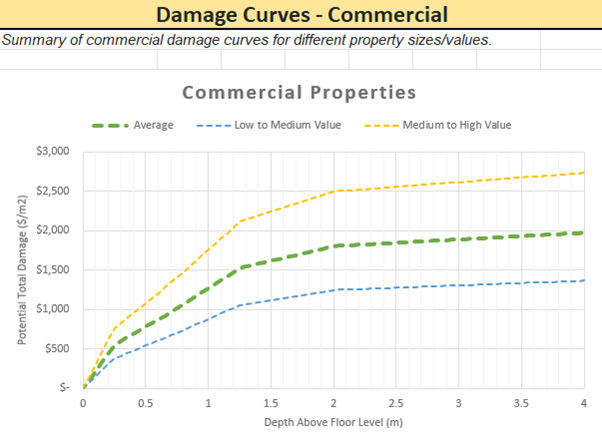
Estimating cost associated with physical damage from the flood waters
Flood losses can be quantified using:
- Flood depth
- Damage curves
- Property size and type
For a large property like this (>70,000 m²), the direct damage bill could be substantial. On top of this, extended downtime due to power outages and restricted access would further reduce operational capacity. To refine the assessment, mitigation measures such as insurance coverage and existing flood defences are factored in, allowing estimation of the net financial impact.
What about Climate Change?
The analysis is then repeated under different climate change pathways to assess how flood risk may evolve over time:
- Short-term (2030)
- Medium-term (2050)
- Long-term (2100)
This typically involves modelling across the five Shared Socioeconomic Pathways (SSPs) and two Representative Concentration Pathways (RCPs). The results provide insight into whether the frequency and severity of flooding will increase, remain stable, or decrease critical for long-term resilience planning.


